Note
Go to the end to download the full example code.
Import and visualize simulation outputs in PyVista#
Once the TOUGH simulation has ended, there is not much things left to do with toughio. We can either:
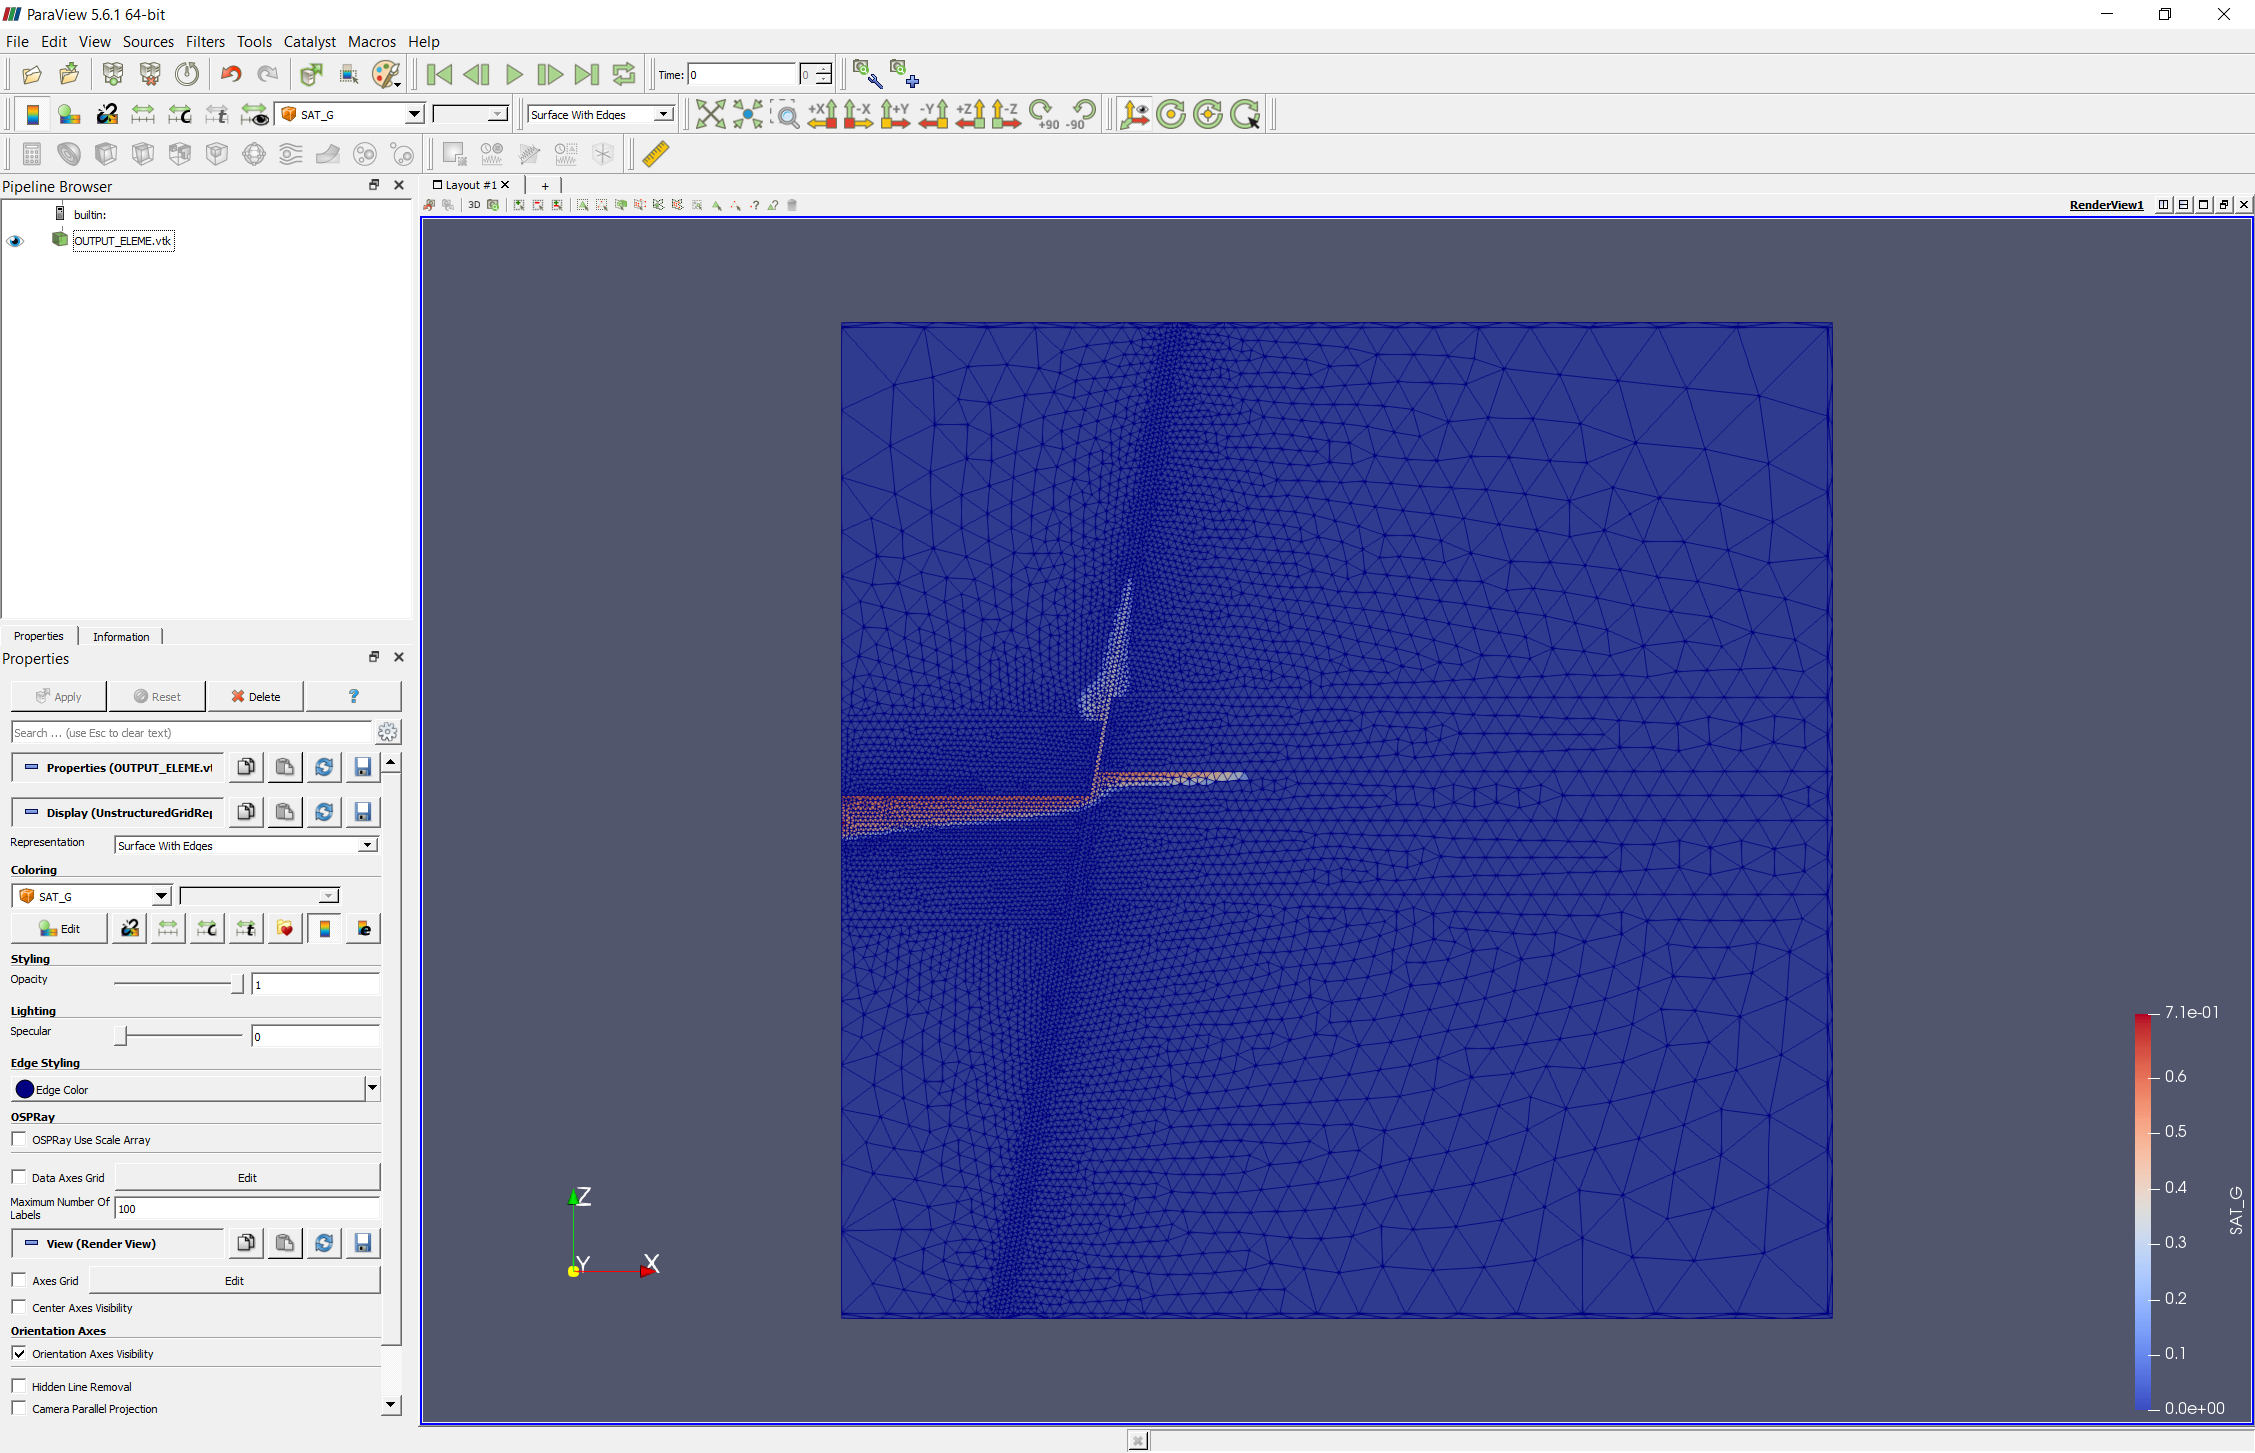
Run the command
toughio-export OUTPUT_ELEME.csv -m mesh.pickleand drag-and-drop the generated VTK file in a compatible visualization software (e.g., ParaView),
Import the output file OUTPUT_ELEME.csv in Python using
toughio(two-liners) and do whatever post-processing we want and need.
This example briefly shows how to import TOUGH output file using toughio and how to visualize it with pyvista (adapted from pyvista’s documentation).
First, we unpickle the mesh file and import the last time step of the output file (OUTPUT_ELEME.csv in TOUGH3, OUTPUT in TOUGH2).
import toughio

mesh = toughio.read_mesh("mesh.pickle")
mesh.read_output("OUTPUT_ELEME.csv", time_step=-1)
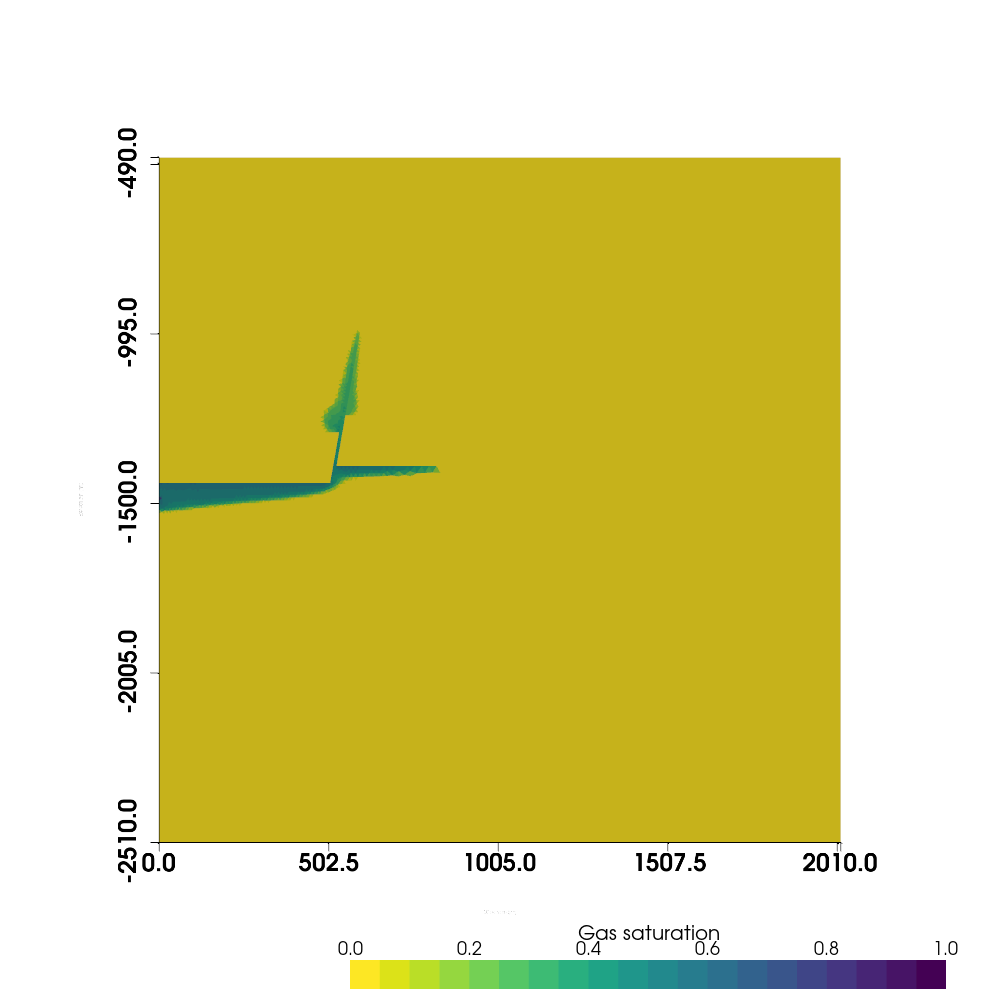
Once output data have been imported, we can simply call the method toughio.Mesh.to_pyvista() to convert the mesh to a pyvista.UnstructuredGrid object that can be processed by pyvista.
import pyvista
pyvista.set_plot_theme("document")

p = pyvista.Plotter(window_size=(1000, 1000))
p.add_mesh(
    mesh.to_pyvista(),
    scalars="SAT_G",
    cmap="viridis_r",
    clim=(0.0, 1.0),
    n_colors=20,
    show_edges=False,
    edge_color=(0.5, 0.5, 0.5),
    scalar_bar_args={
        "title": "Gas saturation",
        "position_y": 0.01,
        "vertical": False,
        "n_labels": 6,
        "fmt": "%.1f",
        "title_font_size": 20,
        "font_family": "arial",
        "shadow": True,
    },
)
p.show_grid(
    show_xaxis=True,
    show_yaxis=False,
    show_zaxis=True,
    xlabel="Distance (m)",
    zlabel="Elevation (m)",
    ticks="outside",
    font_family="arial",
)
p.view_xz()
p.show()
/opt/hostedtoolcache/Python/3.9.19/x64/lib/python3.9/site-packages/pyvista/plotting/renderer.py:1456: PyVistaDeprecationWarning: `xlabel` is deprecated. Use `xtitle` instead.
  warnings.warn(
/opt/hostedtoolcache/Python/3.9.19/x64/lib/python3.9/site-packages/pyvista/plotting/renderer.py:1468: PyVistaDeprecationWarning: `zlabel` is deprecated. Use `ztitle` instead.
  warnings.warn(
Total running time of the script: (0 minutes 1.045 seconds)