Note
Click here to download the full example code
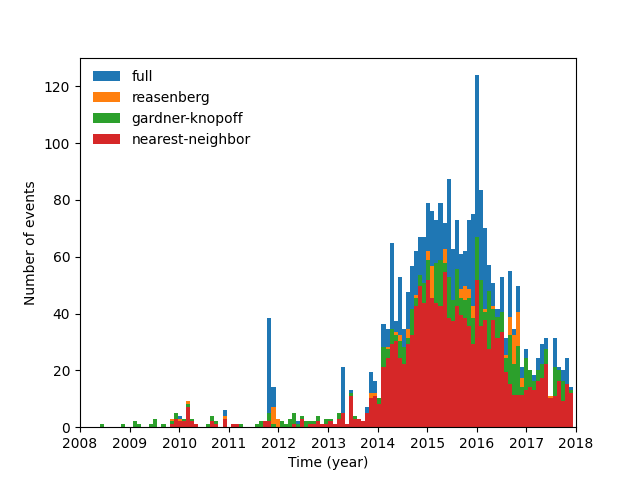
Declustering of earthquake catalog#
This example shows how to decluster a catalog using the method bruces.Catalog.decluster().
This example starts by downloading a ComCat catalog with pycsep.
Fetched ComCat catalog in 5.349629640579224 seconds.

Downloaded catalog from ComCat with following parameters
Start Date: 2008-06-09 22:59:47.120000+00:00
End Date: 2017-12-31 19:09:31.700000+00:00
Min Latitude: 35.0083 and Max Latitude: 36.9963
Min Longitude: -99.3909 and Max Longitude: -96.1792
Min Magnitude: 3.0
Found 2612 events in the ComCat catalog.

<matplotlib.legend.Legend object at 0x7fad1e924cd0>
from datetime import datetime, timedelta
import bruces
import csep
import numpy as np
import matplotlib.pyplot as plt

# Download catalog
start_time = datetime(2008, 1, 1)
end_time = datetime(2018, 1, 1)
catalog = csep.query_comcat(
    start_time=start_time,
    end_time=end_time,
    min_magnitude=3.0,
    min_latitude=35.0,
    max_latitude=37.0,
    min_longitude=-99.5,
    max_longitude=-96.0,
)

# Plot full catalog's seismicity rate
cat = bruces.from_csep(catalog)
dt = timedelta(days=30)
tbins = np.arange(start_time, end_time, dt)
rates, dates = cat.seismicity_rate(tbins)

plt.figure()
plt.bar(dates, rates / 12.0, width=dt, label="full")

# Decluster and plot declustered catalogs' seismicity rates
algorithms = {
    "reasenberg": {},
    "gardner-knopoff": {"window": "uhrhammer"},
    "nearest-neighbor": {"use_depth": True, "seed": 0},
}
for algorithm, kwargs in algorithms.items():
    catd = cat.decluster(algorithm=algorithm, **kwargs)
    rates, dates = catd.seismicity_rate(tbins)
    plt.bar(dates, rates / 12.0, width=dt, label=algorithm)

plt.xlim(start_time, end_time)
plt.xlabel("Time (year)")
plt.ylabel("Number of events")
plt.legend(frameon=False)
Total running time of the script: ( 0 minutes 10.211 seconds)